Radiocarbon Dating of the Shroud of Turin
by
P. E. Damon,1 D. J. Donahue,2 B.
H. Gore,1 A. L. Hatheway,2 A. J. T. Jull,1 T.
W. Linick,2 P. J. Sercel,2 L. J. Toolin,1
C.R. Bronk,3 E. T. Hall,3
R. E. M. Hedges,
3 R. Housley,3 I. A. Law,3 C.
Perry,3 G. Bonani,4 S. Trumbore,5 W.
Woelfli,4 J. C. Ambers,6 S. G. E. Bowman,6 M.
N. Leese6 & M. S. Tite6
Reprinted from Nature, Vol. 337, No. 6208, pp. 611-615, 16th
February, 1989
Copyright 1989 Macmillan Magazines Ltd. - All Rights
Reserved
Reprinted by permission.

1 - Department of Geosciences,
2 - Department of Physics,
University of Arizona, Tucson, Arizona 85721, USA
3 - Research
Laboratory for Archaeology and History of Art, University of Oxford, Oxford,
OX1 3QJ, UK
4 - Institut für Mittelenergiephysik, ETH-Hönggerberg,
CH-8093 Zürich, Switzerland
5 - Lamont-Doherty Geological
Observatory, Columbia University, Palisades, New York 10964, USA
6 -
Research Laboratory, British Museum, London WC1B 3DG, UK
Very small samples from the Shroud of Turin have been dated by
accelerator mass spectrometry in laboratories at Arizona, Oxford and
Zurich. As Controls, three samples whose ages had been determined
independently were also dated. The results provide conclusive evidence
that the linen of the Shroud of Turin is mediaeval.
The Shroud of Turin , which many people believe was used to
wrap Christ's body, bears detailed front and back images of a man who appears
to have suffered whipping and crucifixion. It was first displayed at
Lirey in France in the 1350s and subsequently passed into the hands of the
Dukes of Savoy. After many journeys the shroud was finally brought to
Turin in 1578 where, in 1694, it was placed in the royal chapel of Turin
Cathedral in a specially designed shrine.
Photography of the shroud by Secondo Pia in 1898 indicated
that the image resembled a photographic 'negative' and represents the first
modern study. Subsequently the shroud was made available for scientific
examination, first in 1969 and 1973 by a committee appointed by Cardinal
Michele Pellegrino 1 and then again in 1978 by the Shroud of Turin
Research Project (STURP)2. Even for the first investigation,
there was a possibility of using radiocarbon dating to determine the age of
the linen from which the shroud was woven. The size of the sample then
required, however, was ~500cm, which would clearly have resulted in an
unacceptable amount of damage, and it was not until the development in the
1970s of small gas-counters and accelerator-mass-spectrometry techniques
(AMS), requiring samples of only a few square centimetres, that radiocarbon
dating of the shroud became a real possibility.
To confirm the feasibility of dating the shroud by these
methods an intercomparison, involving four AMS and two small gas-counter
radiocarbon laboratories and the dating of three known-age textile samples,
was coordinated by the British Museum in 1983. The results of this
intercomparison are reported and discussed by Burleigh et
al.3.
Following this intercomparison, a meeting was held in Turin
in September-October 1986 at which seven radiocarbon laboratories (five AMS
and two small gas-counter) recommended a protocol for dating the shroud.
In October 1987, the offers from three AMS laboratories (Arizona, Oxford and
Zurich) were selected by the Archbishop of Turin, Pontifical Custodian of the
shroud, acting on instructions from the Holy See, owner of the shroud.
At the same time, the British Museum was invited to help in the certification
of the samples provided and in the statistical analysis of the results.
The procedures for taking the samples and treating the results were
discussed by representatives of the three chosen laboratories at a meeting at
the British Museum in January 1988 and their recommendations 4 were
subsequently approved by the Archbishop of Turin.
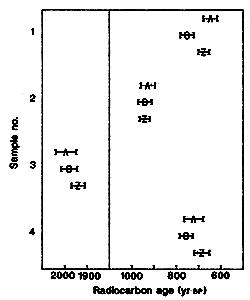 |
FIG.1 Mean radiocarbon dates, with a ±1 sd (sd
= standard deviation) errors, of the Shroud of Turin and
control samples,
as supplied by the three laboratories (A, Arizona; O, Oxford; Z, Zurich) (See
also Table 2.)
The shroud is sample 1, and the three controls are samples
2-4. Note the break in age scale. Ages are given
in yr BP
(years before 1950). The age of the shroud is obtained as AD 1260-1390,
with at least 95% confidence.
|
Removal of samples from the shroud
The sampling of the shroud took place in the Sacristy at
Turin Cathedral on the morning of 21 April 1988. Among those present
when the sample as cut from the shroud were Cardinal Anastasio Ballestrero (Archbishop
of Turin), Professor L. Gonella (Department of Physics, Turin Polytechnic and
the Archbishop's scientific adviser), two textile experts (Professor F.
Testore of Department of Materials Science, Turin Polytechnic and G. Vial of
Musée des Tissues and Centre International d'Étude des Textiles Anciens in
Lyon), Dr M. S. Tite of the British Museum, representatives of the three
radiocarbon-dating laboratories (Professor P. E. Damon, Professor D. J.
Donahue, Professor E. T. Hall, Dr R. E. M. Hedges and Professor W. Woelfli)
and G. Riggi, who removed the sample from the shroud.
The shroud was separated from the backing cloth along its
bottom left-hand edge and a strip (~10 mm x 70 mm) was cut from just above the
place where a sample was previously removed in 1973 for examination. The
strip came from a single site on the main body of the shroud away from any
patches or charred areas. Three samples, each ~50 mg in weight, were
prepared from this strip. The samples were then taken to the adjacent
Sala Capitolare where they were wrapped in aluminium foil and subsequently
sealed inside numbered stainless-steel containers by the Archbishop of Turin
and Dr Tite. Samples weighing 50 mg from two of the three controls were
similarly packaged. The three containers containing the shroud (to be
referred to as sample 1) and two control samples (samples 2 and 3) were then
handed to representatives of each of the three laboratories together with a
sample of the third control (sample 4), which was in the form of threads.
All these operations, except for the wrapping of the samples in foil and their
placing in containers, were fully documented by video film and photography.
The laboratories were not told which container held the
shroud sample. Because the distinctive three-to-one herringbone twill
weave of the shroud could not be matched in the controls, however, it was
possible for a laboratory to identify the shroud sample. If the samples
had been unravelled or shredded rather than being given to the laboratories as
whole pieces of cloth, then it would have been much more difficult, but not
impossible, to distinguish the shroud sample from the controls. (With
unravelled or shredded samples, pretreatment cleaning would have been more
difficult and wasteful.) Because the shroud had been exposed to a wide range
of potential sources of contamination and because of the uniqueness of the
samples available, it was decided to abandon blind-test procedures in the
interests of effective sample pretreatment. But the three laboratories
undertook not to compare results until after they had been transmitted to the
British Museum. Also, at two laboratories (Oxford and Zurich), after
combustion to gas, the samples were recoded so that the staff making the
measurements did not know the identity of the samples.
ControlsThe three control samples, the approximate ages of which were
made known to the laboratories, are listed below. Two were in the
form of whole pieces of cloth (samples 2 and 3) and one was in the form of
threads (sample 4).
Sample 2. Linen (sample QI.T/32) from a tomb
excavated at Qasr Ibrîm in Nubia by Professor J. M. Plumley for the Egypt
Exploration Society in 1964. On the basis of the Islamic embroidered
pattern and Christian ink inscription, this linen could be dated to the
eleventh to twelfth centuries AD.
Sample 3. Linen from the collection of the Department
of Egyptian Antiquities at the British Museum, associated with an early second
century AD mummy of Cleopatra from Thebes (EA6707). This linen was dated
in the British Museum Research Laboratory using liquid scintillation counting,
giving a radiocarbon age of 2,010 ± 80 yr BP (BM-2558). This
corresponds to a calendar age, rounded to the nearest 5 years, of 110 cal BC -
AD 75 cal at the 68 per cent confidence level 5 (where cal denotes
calibrated radiocarbon dates).
Sample 4. Threads removed from the cope of St
Louis d'Anjou which is held in a chapel in the Basilica of Saint-Maximin, Var,
France. On the basis of the stylistic details and the historical
evidence the cope could be dated at ~ AD 1290 - 1310 (reign of King Phillipe
IV).
Measurement proceduresBecause it was not known to what degree dirt,
smoke or other contaminants might affect the linen samples, all three
laboratories subdivided the samples, and subjected the pieces to several
different mechanical and chemical cleaning procedures.
All laboratories examined the textile samples microscopically
to identify and remove any foreign material. The Oxford group cleaned
the samples using a vacuum pipette, followed by cleaning in petroleum ether
(40° C for 1 h) to remove lipids and candlewax, for example. Zurich
precleaned the sample in an ultrasonic bath. After these initial
cleaning procedures, each laboratory split the samples for further treatment.
The Arizona group split each sample into four subsamples.
One pair of subsamples from each textile was treated with dilute HCL, dilute
NaOH and again in acid, with rinsing in between (method a). The second
pair of subsamples was treated with a commercial detergent (1.5% SDS),
distilled water, 0.1% HCL and another detergent (1.5% triton X-100); they were
then submitted to a Soxhlet extraction with ethanol for 60 min and washed with
distilled water at 70° C in an ultrasonic bath (method b).
The Oxford group divided the precleaned sample into three.
Each subsample was treated with 1M HCL (80° C for 2h), 1M NaOH (80° C for 2
h) and again in acid, with rinsing in between. Two of the three samples
were then bleached in NaOCL (2.5% at pH-3 for 30 min).
The Zurich group first split each ultrasonically cleaned
sample in half, with the treatment of the second set of samples being deferred
until the radiocarbon measurements on the first set had been completed.
The first set of samples was further subdivided into three portions.
One-third received no further treatment, one-third was submitted to a weak
treatment with 0.5% HCL (room temperature), 0.25% NaOH (room temperature) and
again in acid, with rinsing in between. The final third was given a
strong treatment, using the same procedure except that hot (80° C) 5% HCL and
2.5% NaOH were used. After the first set of measurements revealed no
evidence of contamination, the second set was split into two portions, to
which the weak and strong chemical treatments were applied.
All of the groups combusted the cleaned textile subsample
with copper oxide in sealed tubes, then converted the resulting CO2
to graphite targets. Arizona and Oxford converted CO2 to CO
in the presence of zinc, followed by iron-catalysed reduction to graphite, as
described in Slota et al. 6. Zurich used
cobalt-catalysed reduction in the presence hydrogen, as described by Vogel
et al. 7,8.
Each laboratory measured the graphite targets made from the
textile samples, together with appropriate standards and blanks, as a group (a
run). Each laboratory performed between three and five independent
measurements for each textile sample which were carried out over a time period
of about one month. The results of these independent measurements (Table
1) in each case represent the average of several replicate measurements made
during each run (samples are measured sequentially, the sequence being
repeated several times). The specific measurement procedures for each
laboratory are given by Linick et al. 9 for Arizona, by
Gillespie et al. 10 for Oxford and by Suter et al.
11 for Zurich. Arizona and Oxford measured
14C/13C ratios by AMS and determined the
13C/12C ratios using conventional mass spectrometry.
Zurich determined both 14C/12C and
13C/12C quasi-simultaneously using AMS only.
The conventional radiocarbon ages were all calculated using
the procedures suggested by Stuiver and Polach12, with
normalization to Ó13C = -25 0/00, and were accordingly reported in yr BP (years before
1950). The errors, which are quoted in Table 1 at the 1sd level
(
sd is standard deviation), include the statistical (counting) error,
the scatter of results for standards and blanks, and the uncertainty in the Ó13C
determination (Arizona includes the Ó13C error at a later stage,
when combining subsample results; Oxford errors below 40 yr are rounded up to
40).
Table 1 Basic Data (individual measurements)
| |
Sample 1 |
Sample 2 |
Sample 3 |
Sample 4 |
Pretreatment and
replication codes |
| Arizona |
AA-3367 |
AA-3368 |
AA-3369 |
AA-3370 |
|
| |
A1.1b* |
591±30 |
A2.1b |
922±48 |
A3.1b |
1,838±47 |
A4.1b |
724±42 |
|
| |
A1.2b |
690±35 |
A2.2a |
986±56 |
A3.2a(1) |
2,041±43 |
A4.2a |
778±88 |
a, method a |
| |
A1.3a |
606±41 |
A2.3a(1) |
829±50 |
A3.3a |
1,960±55 |
A4.3a(1) |
764±45 |
b, method b |
| |
A1.4a |
701±33 |
A2.4a(2) |
996±38 |
A3.4a(2) |
1,983±37 |
A4.4a(2) |
602±38 |
( ), same subsample |
| |
A2.5b |
894±37 |
A3.5b |
2,137±46 |
A4.5b |
825±44 |
|
| Ó13C (0/00) |
|
-25.0 |
|
-23.0 |
|
-23.6 |
|
-25.0 |
|
| |
| Oxford |
2575 |
2574 |
2576 |
2589 |
|
| |
O1.1u |
795±65 |
O2.1u |
980±55 |
O3.1u |
1,955±70 |
O4.2u |
785±50 |
u, unbleached |
| |
O1.2b |
730±45 |
O2.1b |
915±55 |
O3.1b |
1,975±55 |
O4.2b(1) |
710±40 |
b, bleached |
| |
O1.1b |
745±55 |
O2.2b** |
925±45 |
O3.2b |
1,990±50 |
O4.2b(2) |
790±45 |
( ), same pretreatment/
run
combination |
| Ó13C***(0/00) |
|
-27.0 |
|
-27.0 |
|
-27.0 |
|
-27.0 |
|
| |
| Zurich |
ETH-3883 |
ETH-3884 |
ETH-3885**** |
ETH-3882 |
|
| |
Z1.1u |
733±61 |
Z2.1u |
890±59 |
Z3.1u |
1,984±50 |
Z4.1u |
739±63 |
|
| |
Z1.1w |
722±56 |
Z2.1w |
1,036±63 |
Z3.2w |
1,886±48 |
Z4.1w |
676±60 |
u, ultrasonic only |
| |
Z1.1s |
635±57 |
Z2.1s |
923±47 |
Z3.2s |
1,954±50 |
Z4.1s |
760±66 |
w, weak |
| |
Z1.2w |
639±45 |
Z2.2w |
980±50 |
|
Z4.2w |
646±49 |
s, strong |
| |
Z1.2s |
679±51 |
Z2.2s |
904±46 |
|
Z4.2s |
660±46 |
|
| ÓC***** (0/00) |
|
-25.1 |
|
-23.6 |
|
-22.0 |
|
-25.5 |
|
In years BP,
corrected for Ó13C fractionation; errors at 1 sd level; see text
for pretreatment details.
* The identification
code for each measurement shows, in order, the laboratory, sample, measurement
run, pretreatment and any replication involved.
** One anomalous replicate (of 6) obtained for independent
measurement O2.2b; if rejected it reduces date by 40 yr; final date quoted
actually reduced by 20 yr.
*** Measured for
samples 1 and 3; assumed for samples 2 and 4.
**** The loose weave of sample Z3.1 led to its disintegration during
strong and weak chemical treatments. Z3.2 was centrifuged to avoid the
same loss of material.
***** Average of
separate determinations by AMS.
Results
On completion of their measurements, the laboratories
forwarded their results to the British Museum Research Laboratory for
statistical analysis. The individual results as supplied by the
laboratories are given in Table 1. Each date represents a unique
combination of pretreatment and measurement run and applies to a separate
subsample, except where indicated by the identification code. From these
data it can be seen that, for each laboratory, there are no significant
differences between the results obtained with the different cleaning
procedures that each used.
Table 2 Summary of mean radiocarbon dates and assessment of
interlaboratory scatter
| Sample |
1 |
2 |
3 |
4 |
| Arizona |
646 ± 31 |
927 ± 32 |
1,995 ± 46 |
722 ± 43 |
| Oxford |
750 ± 30 |
940 ± 30 |
1,980 ± 35 |
755 ± 30 |
| Zurich |
676 ± 24 |
941 ± 23 |
1,940 ± 30 |
685 ± 34 |
| |
| Unweighted mean* |
691 ± 31 |
936 ± 5 |
1,972 ±16 |
721 ± 20 |
| Weighted mean** |
689 ± 16 |
937 ± 16 |
1,964 ± 20 |
724 ± 20 |
| X 2 value (2 d.f.) |
6.4 |
0.1 |
1.3 |
2.4 |
| Significance *** level (%) |
5 |
90 |
50 |
30 |
Dates are in yr BP. d.f., degrees of freedom.
* Standard errors based on scatter.
**
Standard errors based on combined quoted errors.
*** The probability of obtaining, by chance, a scatter among the three
dates as high as that observed, under the assumption that the quoted errors
reflect all sources of random variation.
The mean radiocarbon dates and associated uncertainties for
the four samples, as supplied by each of the three laboratories, are listed in
Table 2 and shown in Fig.1. Also included in Table 2 are the overall
unweighted and weighted means, the weights being proportional to the inverse
squared errors as quoted by the laboratories. The underlying principle
of the statistical analysis has been to assume that, unless there is strong
evidence otherwise, the quoted errors fully reflect all sources of error and
that weighted means are therefore appropriate. An initial inspection of
Table 2 shows that the agreement among the three laboratories for samples 2, 3
and 4 is exceptionally good. The spread of the measurements for sample 1
is somewhat greater than would be expected from the errors quoted.
More quantitatively, to establish whether the scatter among
the three laboratory means was consistent with their quoted errors, a X2
test was applied to the dates for each sample, in accordance with the
recommended procedure of Ward and Wilson 13. The results of
this test, given in Table 2, show that it is unlikely that the errors quoted
by the laboratories for sample 1 fully reflect the overall scatter. The
errors might still reflect the uncertainties in the three dates relative to
one another, but in the absence of direct evidence on this, it was decided to
give the three dates for sample 1 equal weight in determining the final mean,
and to estimate the uncertainty in that mean from the scatter of results.
As shown in Table 2, the unweighted mean of the radiocarbon
age of sample 1 and its uncertainty are 691 ± 31 yr BP. The confidence
limits for sample 1 were obtained by multiplying the uncertainty by
td, the value of a Student's t distribution with d
degrees of freedom at the appropriate probability level. The value
of d, which lies between the inter- and intra-laboratory degrees of
freedom -- that is, between 2 and 9 -- was estimated at 5 on the basis of an
analysis of variance on the 12 individual measurements supplied by the
laboratories 14. Individual measurements from a particular
laboratory were weighted according to their inverse squared errors, but the
contributions from different laboratories were weighted equally, thus ensuring
consistency with Table 2. Thus for sample 1, where the error has been
estimated from the scatter, ~68% and 95% confidence limits for the true
radiocarbon date were found from the 1.1 sd and 2.6 sd errors
about the unweighted mean respectively, the multiplying factors being obtained
from standard tables of the t5 distribution. However,
for samples 2, 3, and 4, the limits were obtained in the usual way from 1
sd and 2 sd quoted errors about the weighted means, assuming
normality.
 |
The calendar-age ranges which correspond to the radiocarbon
confidence limits are show in Table 3. These were determined from the
high-precision curve of Stuiver and Pearson 5 based on
dendrochronological dating. Method A (the intercept method) in revision 2.0 of
the University of Washington Quaternay Isotope Laboratory Radiocarbon
Calibration Program 15 was used. In this method, the error
in the calibration curve is first incorporated into the radiocarbon error,
thus widening the limits on the radiocarbon scale slightly; calendar ages are
then found that correspond to these limits, without transforming the complete
probability distribution of radiocarbon dates. No additional uncertainty
has been added to take account of the short growth period of textile samples.
There is little published guidance on this, although it has been suggested
that 15 years should be added in quadrature to the overall uncertainty in the
radiocarbon date for samples of growth period less than one year, such as
linen. In general, such additional uncertainty would widen the 95%
calendar limits by ~ 2 - 4 years at either end, except for sample 3 where the
9 cal BC limit would be changed to 34 cal BC.
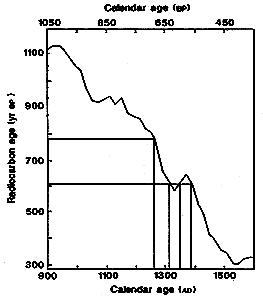
The 95% limits for the shroud are also illustrated in Fig. 2,
where it is apparent that the calibration of the radiocarbon date for sample 1
gives a double range. The correct transformation of probability
distributions from the radiocarbon to the calendar scale is still subject to
debate, there being two different methods of dealing with multiple intercepts.
However, both methods agree that the major probability peak lies in the
earlier of the two ranges, in the 68% range at the end of the thirteenth
century. Sample 4 has a very narrow calendar range: this is due to the
steep slope in the calibration curve at this point, and is an occasional
instance of calibration reducing rather than increasing a confidence
range. Sample 3 compares well with the date obtained by conventional
radiocarbon dating; there is no evidence for a difference between the two
results. The dates for samples 2 and 4 agree with the historical
evidence, which places them in the eleventh to twelfth centuries and late
thirteenth/early fourteenth centuries AD respectively.
The results, together with the statistical assessment of the
data prepared in the British Museum, were forwarded to Professor Bray of the
Istituto di Metrologia 'G. Colonetti', Turin, for his comments. He
confirmed that the results of the three laboratories were mutually compatible,
and that, on the evidence submitted, none of the mean results was questionable.
Table 3 Calibrated date ranges at the 68% and 95% confidence
levels
| Sample |
Mean Date (yr BP) |
|
Calendar date ranges |
| 1* |
691 ± 31 |
68% |
AD 1273 - 1288 |
| |
95% |
AD 1262 - 1312, 1353 - 1384 cal |
| 2 ** |
937 ± 16 |
68% |
AD 1032 - 1048, 1089 - 1119, 1142 - 1154
cal |
| |
95% |
AD 1026 - 1160 cal |
| 3** |
1,964 ± 20*** |
68% |
AD 11-64 cal |
| |
95% |
9 cal BC - AD 78 cal |
| 4** |
724 ± 20 |
68% |
AD 1268 - 1278 cal |
| |
95% |
AD 1263 - 1283
cal |
* Confidence
limits on the radiocarbon scale found from the standard error on the
unweighted mean, assuming a t5 distribution (multiplying
factors 1.1 and 2.6 for 68% and 95% respectively). Standard error estimated
from scatter.
** Confidence limits on the radiocarbon
scale found from the standard error on the weighted mean, assuming a normal
distribution (multiplying factors 1 and 2 for 68% and 95% limits
respectively). Standard error computed from quoted errors.
*** Date by convential radiocarbon dating at
the British Museum: 2010 ± 80 yr. BP (MB - 2558).
ConclusionsThe results of radiocarbon measurements at Arizona, Oxford
and Zurich yield a calibrated calendar age range with at least 95% confidence
for the linen of the Shroud of Turin of AD 1260 - 1390 (rounded down/up to
nearest 10 yr). These results therefore provide conclusive evidence that
the linen of the Shroud of Turin is mediaeval.
The results of radiocarbon measurements from the three
laboratories on four textile samples, a total of twelve data sets, show that
none of the measurements differs from its appropriate mean value by more than
two standard deviations. The results for the three control samples agree
well with previous radiocarbon measurements and/or historical dates.
We thank Cardinal Anastasio Ballestrero for allowing us
access to the shroud, Professor L. Gonella for his help and support
throughout the project and Professor A. Bray for commenting on our statistical
assessment of the data. We also thank Miss E. Crowfoot, T. G. H. James,
Dr J. Evin, M. Prevost-Macillacy, G. Vial, the Mayor of Saint-Maximin
and the Egypt Exploration Society for assistance in obtaining the three
known-age control samples. Oxford thank P. H. South (Precision Process
(Textiles) Ltd, Derby) for examining and identifying the cotton found on the
shroud sample; R. L. Otlet (Isotopes Measurement Laboratory, AERE, Harwell)
for stable isotope ratio measurements on two samples; J. Henderson and the
Department of Geology, Oxford Polytechnic for undertaking scanning electron
microscopy, and SERC for the Special Research Grant which provided the primary
support for the Radiocarbon Accelerator Unit. Zurich thank the Paul
Scherrer Institut (PSI, CH-5234 Villigen) for technical and financial
support. The AMS Programme at Arizona is partially supported by a grant
from the NSF.
- La S. Sindone-Ricerche e studi della Commissione di Esperti nominata
dall' Arcivescovo di Torino, Cardinal Michele Pellegrino, nel 1969
Supplemento Rivista Diocesana Torinese (1976).
- Jumper, E.J. et al. in Archaeological Chemistry-III (ed.
Lambert, J. B.) 447-476 (Am. chem. Soc., Washington, 1984).
- Burleigh, R., Leese, M. N. & Tite, M.S. Radiocarbon
28, 571-577 (1986).
- Tite, M.S. Nature 332, 482 (1988)
- Stuiver, M. & Pearson, G.W. Radiocarbon 28, 805-838
(1986).
- Slota, P.J., Jull, A. J. T., Linick, T. W. & Toolin, L. J.
Radiocarbon 29, 303-306 (1987).
- Vogel, J. S., Nelson, D.E. & Southon, J.R. Radiocarbon
29, 323-333 (1987).
- Vogel, J. S., Southon, J.R. & Nelson, D.E. Nucl. Instrum.
Meth. B29, 50-56 (1987).
- Linick, T. W., Jull, A. J. T., Toolin, L. J. & Donahue, D. J.
Radiocarbon 28, 522-533 (1986).
- Gillespie, R., Gowlett, J. A. J., Hall, E. T. & Hedges, R. E. M.
Archaeometry 26, 15-20 (1984).
- Suter, M. et. al. Nucl. Instrum. Meth. 233[B5], 117-122
(1984).
- Stuiver, M. & Polach, H. A. Radiocarbon 19, 355-363
(1977).
- Ward, G. K. & Wilson, S. R. Archaeometry 20, 19-31
(1978).
- Caulcott, R. & Boddy, R. Statistics for Analytical Chemists
(Chapman and Hall, London, 1983).
- Stuiver, M. & Reimer, P. J. Radiocarbon 28, 1022-1030
(1986).
IG. 2 Calibration of the overall mean radiocarbon date
for sample 1 (the Shroud of Turin) using the
'intercept' method. (See
also Table 3.) Calibration is necessary because of natural variations in
atmospheric14C.
The calibration curve for the relevant
period is that of Stuiver and Pearson 5, a portion of which is
illustrated.
The uncertainty in the calibration curve has been
combined with the error in the mean radiocarbon date, giving the 95%
confidence
limits on the radiocarbon scale; the error envelope on the curve has
therefore been omitted from the diagram.
The stippled areas show how
the 95% confidence limits are transformed from the radiocarbon to the
calendar scale. | |